Renell Santos
Data Portfolio
Overview
Welcome to my Data Portfolio! 🚀
This portfolio showcases my expertise in Data Analytics, Business Intelligence, and Data Engineering.
Here, you’ll find my best projects featuring interactive dashboards, data pipelines, and end-to-end data workflows using tools like Power BI, SQL, Python, and cloud platforms.
Table of Contents
- Overview
- Dashboards and Reports
- Programming and Data Analysis
- Kaggle
- Tableau
- Power BI
- Looker
- Google Analytics
- Certificates/Certifications
- Conclusion
Dashboards and Reports
I have developed interactive dashboards and reports using:
- Tableau
- Power BI
- Looker
- Google Sheets
- MS Excel
These projects demonstrate my ability to present data that helps stakeholders understand key insights for decision-making.
Programming and Data Analysis
I also included my work on:
- SQL
- R
- Python
These projects demonstrate my ability to extract insights from complex data.
📂 Telco Churn Analysis
🚀 Goal:
- Analyze customer churn patterns in a telecommunications company using ETL, SQL, and Power BI.
🔧 Tools Used:
✅ Python (pandas, psycopg2, SQLAlchemy)
✅ PostgreSQL (Database for structured storage)
✅ Power BI (Data visualization & insights)
✅ SQL (Querying and data transformation)
📌 Workflow:
1️⃣ Extract - Scraped Telco customer data from a CSV file.
2️⃣ Transform - Cleaned & formatted the data using Python.
3️⃣ Load - Stored the data in a PostgreSQL database.
4️⃣ Analyze - Wrote SQL queries to extract key insights.
5️⃣ Visualize - Built an interactive Power BI dashboard.
📈 Key Insights:
📌 Senior citizens churn more often than younger users.
📌 Customers with month-to-month contracts are more likely to leave.
📌 Higher total charges reduce the likelihood of churn.
| 🔗 GitHub Repo | 📊 Power BI Dashboard |
📸 Screenshots
✅ Python Script Execution
![Python Script Running]
✅ PostgreSQL Database Table
![PostgreSQL Data]
✅ Power BI Dashboard
![Power BI Dashboard]
📈 Insights & Findings
🔹 Senior citizens have a higher churn rate.
🔹 Month-to-month contracts have the highest churn.
🔹 Higher total charges reduce churn likelihood.
📂 Job Board Scraper
🚀 Goal:
Automate job listing extraction from multiple websites and visualize hiring trends in Power BI.
🔧 Tech Stack:
✅ Python (BeautifulSoup, Requests, Selenium)
✅ SQL (Data storage & transformation)
✅ Power BI (Interactive job market dashboard)
📌 Workflow:
1️⃣ Scrape - Extract job data from multiple online job boards.
2️⃣ Clean - Remove duplicates and standardize job descriptions.
3️⃣ Store - Save structured data in an SQL database.
4️⃣ Analyze - Find hiring trends, most in-demand roles, and top locations.
5️⃣ Visualize - Power BI dashboard for real-time job market insights.
📈 Key Insights:
📌 Most in-demand skills: Python, SQL, Power BI.
📌 Remote jobs increased by 30% in the last year.
📌 Top hiring industries: Tech, Finance, and Healthcare.
| 🔗 GitHub Repo | 📊 Power BI Dashboard |
Kaggle
Tableau
🚀 Tableau Viz - Seoul Bike Rentals
Analyzed bike rental patterns across different weather conditions to optimize bike-sharing operations.
🔗 Tableau Report: [Your Tableau Link Here]
Power BI
[Preview]
✅ Example for Power BI:
🚀 Power BI Dashboard - Restaurant Sales Analysis
- This dashboard visualizes monthly sales trends, customer demographics, and transaction types to help restaurant managers optimize their menu and operations.
🔗 Power BI Report: [Your Power BI Link Here]
Looker
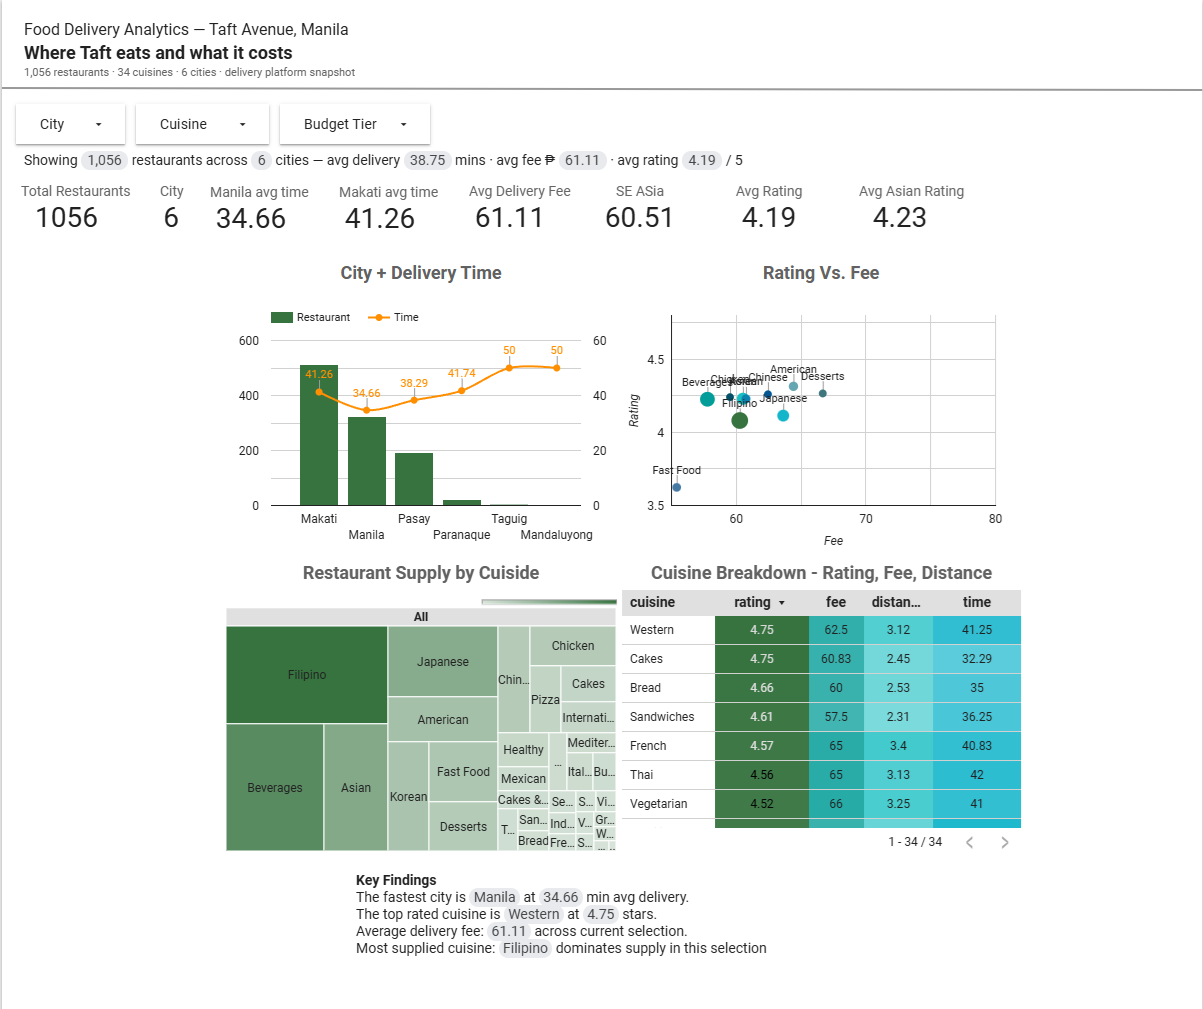
📂 Food Delivery Landscape — Taft Avenue, Manila
🚀 Goal: Identify high-value cuisine opportunities and pricing inefficiencies in Taft Avenue’s food delivery market
🔧 Tools Used: ✅ Looker Studio (Dashboard + visualizations) ✅ Google Sheets (Data source + calculated fields) ✅ Looker Studio Query Result Variables (Dynamic insight text)
📌 What makes this analysis different: This project goes beyond visualization by engineering decision-focused metrics directly in the data layer:
- Value Index → identifies cuisines offering highest quality per peso
- Delivery Time Gap (Manila vs Makati) → highlights operational efficiency differences
- Budget Tier Segmentation → simplifies pricing strategy analysis
These power a dynamic insights panel that updates in real time based on user filters.
📈 Key Findings:
- Manila delivers 6.6 minutes faster than Makati despite lower restaurant density — indicating stronger delivery efficiency.
- Filipino cuisine dominates supply (189 restaurants), suggesting high competition and potential saturation.
- French cuisine shows the highest ratings (~4.57) among well-represented categories — a potential premium niche.
- Most cuisines cluster in the ₱30–65 fee range, indicating a tight pricing band with limited differentiation.
💡 Business Recommendations:
- Explore underrepresented high-rating cuisines (e.g., French) for premium positioning
- Investigate Manila’s delivery model for potential replication in Makati
- Differentiate pricing strategies outside the ₱30–65 cluster to avoid competition saturation
📸 Dashboard Preview
Google Analytics
[Preview]
Certificates/Certifications
I believe showcasing skills through work is ideal but credentials also speak skill. My certificates/certifications are listed here, along with the dates of completion, in reverse chronological order:
- IBM Data Engineering Essentials (Coursera 2025)
- Google Prompting Essentials (Coursera 2025)
- Introduction to Data Analytics in Google Cloud (Coursera 2024)
- Google Cloud Digital Leader Training (Coursera 2024)
- Google Advanced Data Analytics (Coursera 2024)
- Python (Kaggle 2024)
- Intro to Programming (Kaggle 2024)
- Advanced Relational Database and SQL (Coursera 2024)
- Intermediate Relational Database and SQL (Coursera 2024)
- Introduction to Relational Database and SQL (Coursera 2024)
- Google Business Intelligence (Coursera 2024)
- Google Data Analytics (Coursera 2024)
- Foundations of Digital Marketing and E-commerce (Coursera 2024)
- Google Project Management (Coursera 2023)
Conclusion
Thank you for taking the time to review my portfolio. I look forward to connecting with you soon.
📬 Contact Me
📧 Email: santosrenell304@gmail.com
🔗 LinkedIn: linkedin.com/in/renell-santos